Open Activity Monitor while a local AI app is running and you will find a process called chrome_crashpad_handler sitting underneath it. The name is unhelpful in a specific way: it contains the word Chrome in an application that is not a browser, and it describes a component whose entire job is to package up what your machine was doing when something went wrong. It is the process people point at when they ask whether a local tool is really local.
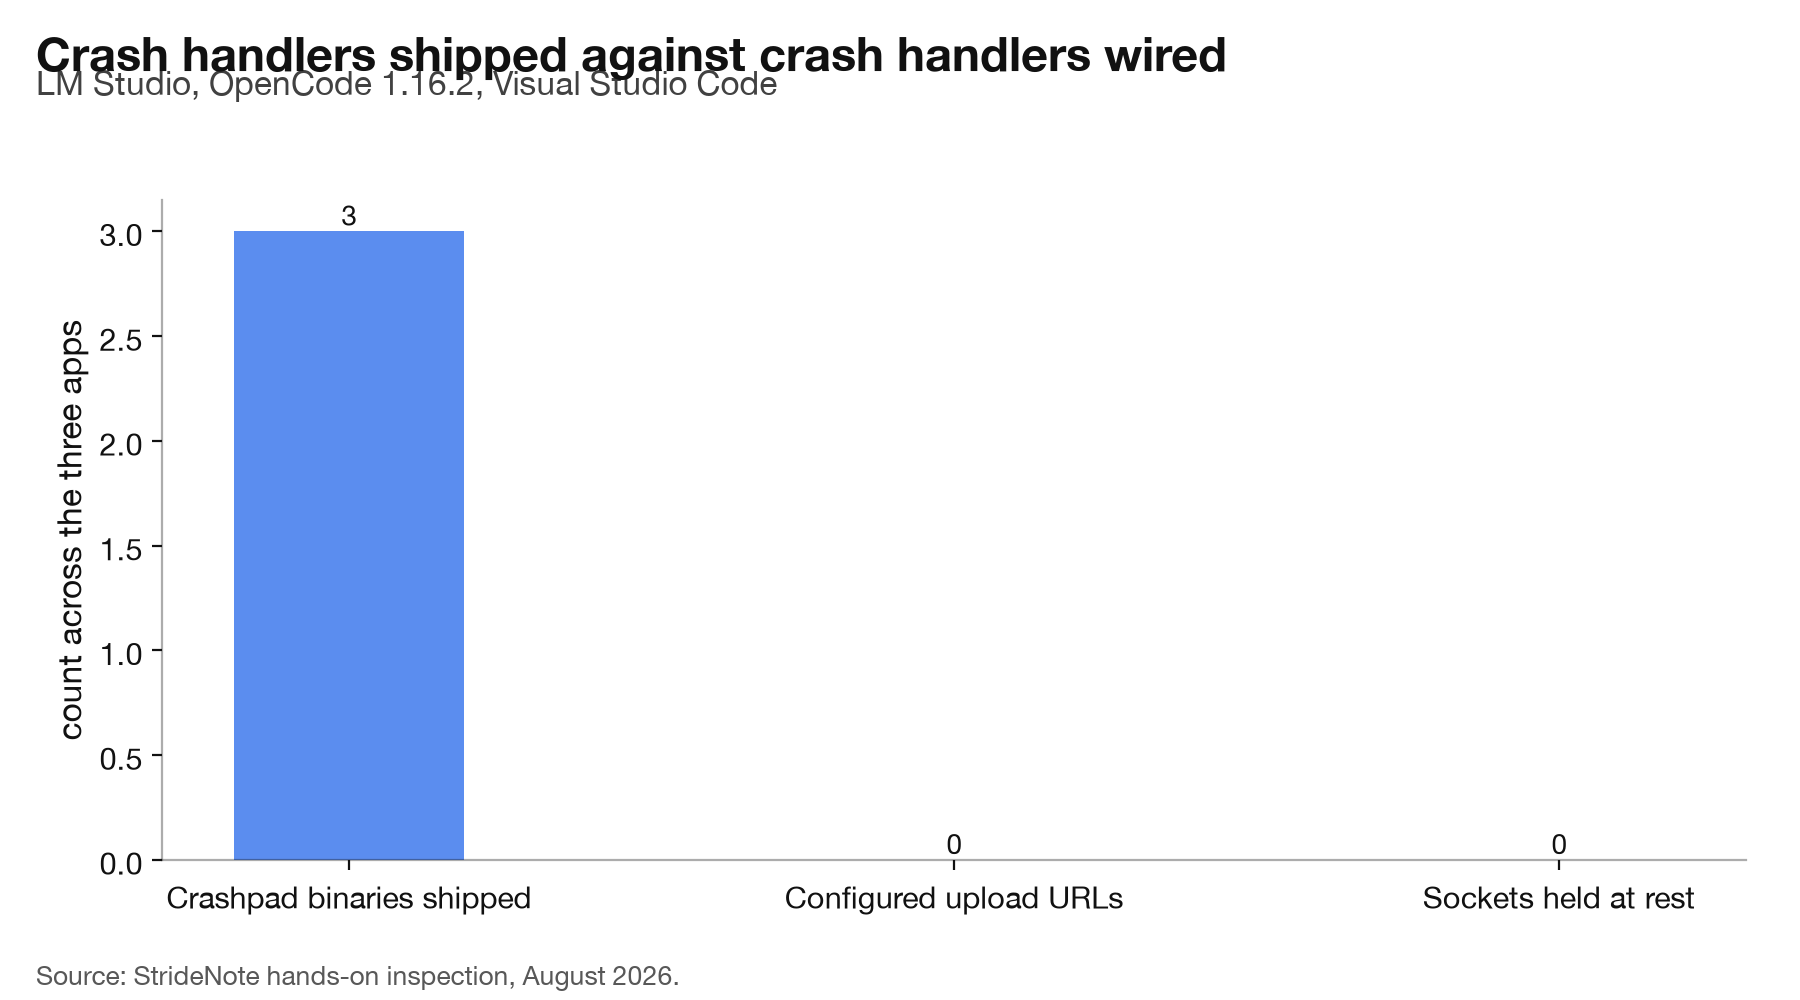
We checked three of them on a studio work/test stack, an Apple M4 Pro with 48 GB of unified memory. All three ship the handler. None of the three has it wired to anywhere.
What is chrome_crashpad_handler doing in a local AI app?
It arrives with Electron, and Electron arrives with almost everything.
LM Studio, OpenCode and Visual Studio Code are all Electron applications, which means each one embeds a copy of Chromium. Crashpad is Chromium’s crash-reporting system, and it ships as part of that embedded runtime rather than as a choice any of these vendors made. Searching each bundle finds exactly one crashpad binary in all three, which is what you would expect from a component that comes along for the ride.
So its presence tells you the app is built on Electron. It tells you nothing at all about whether crash data leaves your machine.
Does the crash reporter actually upload anything?
Not in any of the three, on the evidence available.
Electron’s crashReporter API requires two things before a report goes anywhere: the application must call crashReporter.start(), and that call must be given a submitURL pointing at a collector. Without a destination, crashpad still runs, still catches crashes, and still writes dumps locally. It just has nowhere to send them.
We searched all three bundles for a configured destination. The strings submitURL and uploadToServer appear in each, which is unsurprising because those are the names of the API’s own parameters and the framework code that reads them is bundled too. What is absent in every case is an actual URL assigned to that parameter. No collector address, in any of the three.
The live check agrees. LM Studio’s crashpad handler was running throughout our inspection, and it held no sockets at all: not an established connection, not even a listener.
One difference between the three is worth recording, because it shows how little the amount of machinery tells you. Counting references to crashReporter across each bundle gives LM Studio one, OpenCode two, and Visual Studio Code thirty-six. Microsoft ships far more crash-handling code than either AI tool, which fits a product with a large support operation behind it. It still has no collector address in the bundle we inspected. Thirty-six references and one reference end up in the same place, which is the point: the volume of code is not the signal, the destination is.
Then where does the reporting actually happen?
In a library nobody notices, which is the part worth taking away.
OpenCode does report errors. We established that separately: a production Sentry DSN is compiled into the application, and on launch it opens a connection to the address that DSN resolves to, before any prompt is typed. The full account is in our OpenCode audit.
But that reporting does not travel through crashpad. It travels through the Sentry JavaScript SDK, which is an ordinary dependency doing an ordinary thing, and which produces no distinctively named process for anyone to notice in Activity Monitor. LM Studio, by contrast, carries no Sentry references at all, and its network behaviour at rest is what we found when we audited it: nothing established, only localhost listeners.
That inverts the intuition. The component with the alarming name is idle. The component doing the reporting is a JavaScript library with a name that would not make anyone look twice.
What this means for judging a local tool
Three practical conclusions, in the order they should change what you do.
Stop treating the crashpad process as evidence. It appears under every Electron app on your machine, AI or otherwise, and its presence is a fact about the build system rather than about the vendor’s intentions. Judging a tool by that process will make you suspicious of software that is behaving and relaxed about software that is not.
Look for the destination, not the machinery. The question that separates the three apps here is not whether a crash reporter exists but whether anyone pointed it at a server. That is a one-line difference in a configuration file and it is the whole distinction.
Watch the sockets, because that is the ground truth. Bundled code can be dead. A configured URL might never fire. An established connection to an address you can resolve is the only one of the three that cannot be argued with, and it is the cheapest to check.
We should be plain about what this audit does not cover. We did not induce a crash in any of the three applications. Crashpad writes dumps locally whether or not it uploads them, and an app could in principle collect those dumps by some other route later. What we can say is narrower and still useful: at rest, with a model loaded and the apps running normally, the crash handlers were doing nothing and had nowhere to send anything if they had been.
The broader pattern is one we keep meeting across these telemetry investigations. The thing that looks like surveillance is usually inert, and the thing that is actually transmitting looks like housekeeping. Both facts are visible from your own machine in about a minute, which is a better basis for trusting a tool than the name of a process.