A coding agent is an unusual thing to point at your source tree. It reads whatever you give it, and on a desktop build it also carries whatever the packager decided to include. We inspected OpenCode 1.16.2 on a studio work/test stack, an Apple M4 Pro with 48 GB of unified memory, then launched it and watched the sockets. It opens two outbound connections before you type a character, and one of them is a crash-reporting endpoint whose address is compiled into the application.
The other two things we thought we had found turned out to be nothing, and that part is worth reading as carefully as the finding.
Does OpenCode send telemetry?
Yes, to Sentry, and the configuration is not ambiguous.
Searching the application bundle turns up a complete production configuration, not a placeholder:
“
VITE_SENTRY_DSN: https://
VITE_SENTRY_ENVIRONMENT: production
VITE_SENTRY_RELEASE: desktop@1.16.2
`
A DSN is app-specific. Library code ships with the machinery to talk to Sentry; only the developer supplies the address of their own project. An environment marked production and a release identifier matching the app version are the marks of a deliberately wired integration.
Configuration is not transmission, though, so we launched the app and listed every socket held by all five of its processes. Two connections were established, with no prompt typed and no project opened:
`
OpenCode
OpenCode
`
Resolving the DSN hostname settles it. The ingest.us.sentry.io host named in that DSN resolves to 34.160.81.0, the first address in that list. OpenCode reaches its crash-reporting endpoint on startup.
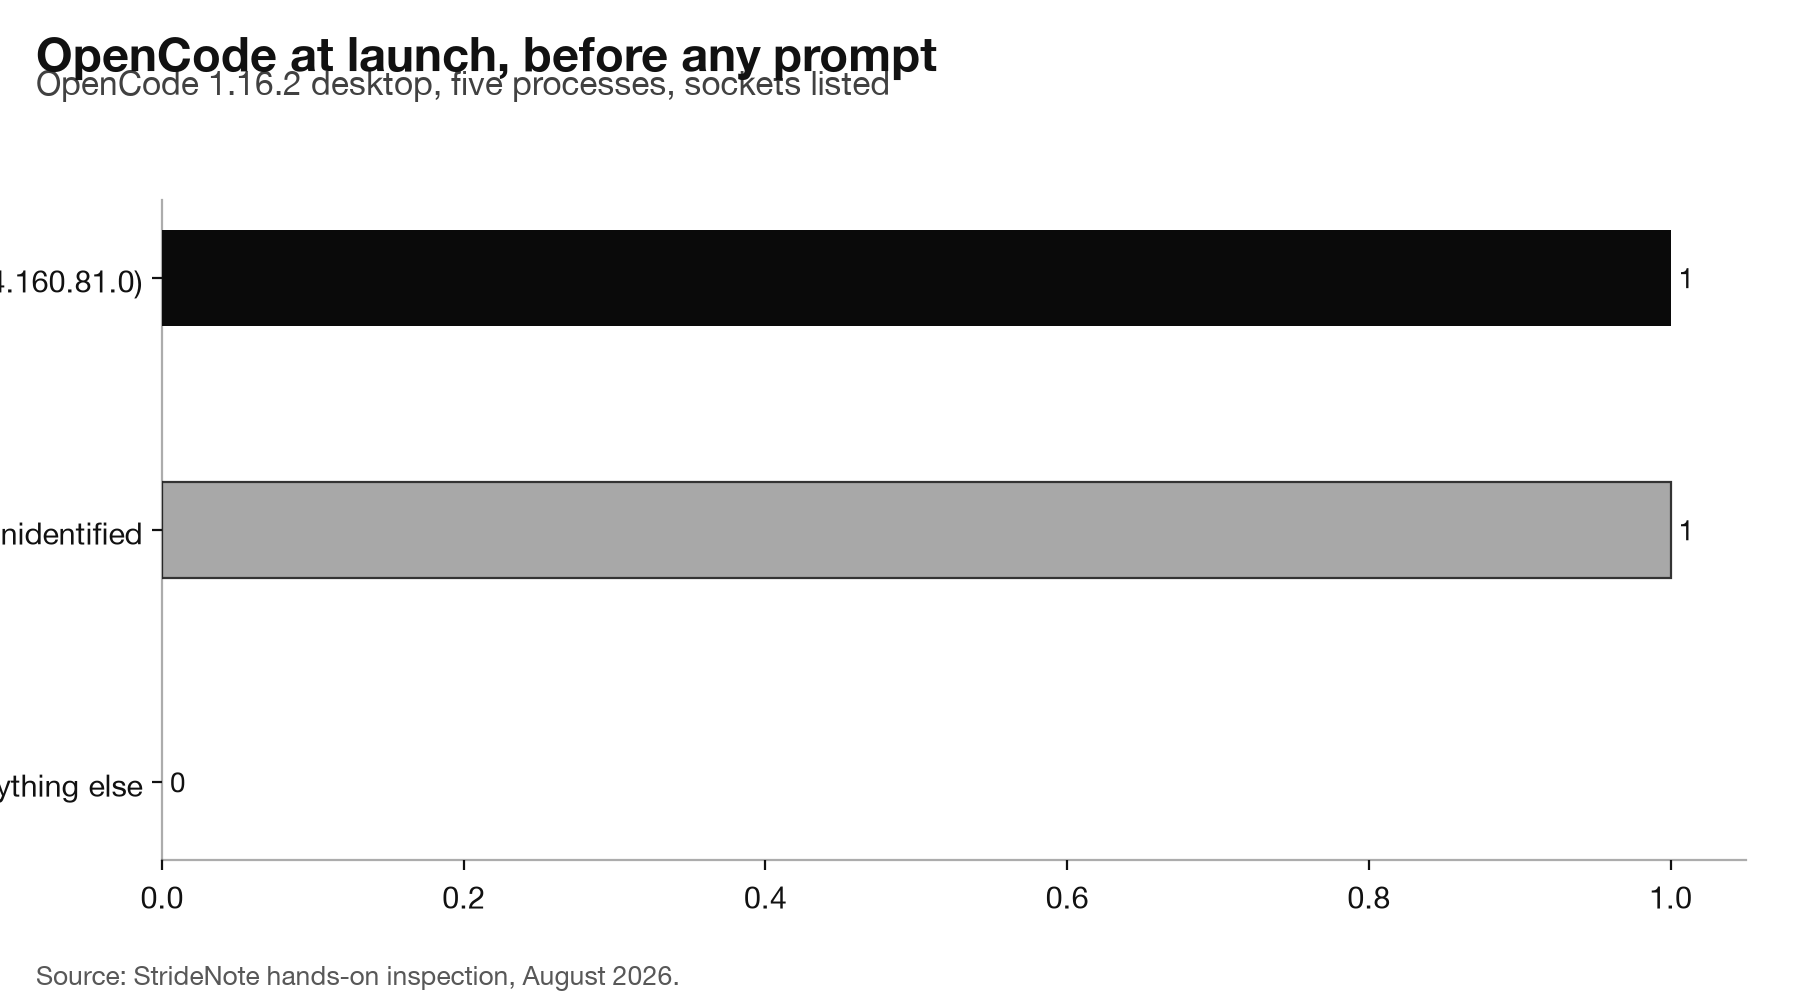
The second address, 104.16.6.34, sits in Cloudflare space and does not match the addresses opencode.ai resolves to. The bundle references opencode.ai/config.json and opencode.ai/desktop-theme.json, so a configuration or theme fetch is the obvious candidate, but we did not confirm it and will not assert it.
What does a Sentry connection actually carry?
This is where proportion matters, because "connects to a crash reporter" is not the same as "uploads your code".
Per Sentry's own documentation on data collected, a browser or Electron SDK sends error events with stack traces, the release and environment, OS and runtime versions, breadcrumbs describing recent application activity, and the IP address the request came from. Whether personally identifying data travels depends on a sendDefaultPii flag, and the SDK's handling of that flag is present in the bundle. One item on that list does not apply here: OpenCode's init call filters the Breadcrumbs integration out of Sentry's default set, the one that records user actions in the moments before an error, and our July reading of the bundle found that filter in place.
So the realistic exposure is: your operating system, your app version, your IP, and the contents of any error. That last one is the part worth thinking about for a coding tool, because a stack trace from an application that handles file paths can contain file paths.
We did not induce a crash, so we cannot tell you what a real OpenCode error event contains. That measurement needs a local sink and a deliberately broken run, and it is the obvious follow-up. It is also the method that produced our fullest picture of a tool's traffic when we mapped OpenCode against OpenJarvis on telemetry, where recording every request over a working session showed things a launch-time snapshot cannot.
The two findings that were not real
We nearly published both. They are instructive because each looked stronger than the thing that turned out to be true.
"OpenCode ships Amplitude analytics." A search of the bundle returns fifteen hits for amplitude. Amplitude is a well-known product-analytics vendor, and fifteen occurrences in a desktop app is the sort of number that writes its own headline. Reading the surrounding characters rather than counting them shows what they are:
`
alignmentBaseline:null, alphabetic:VE, amplitude:VE, arabicForm:null, ascent:VE
“
That is a DOM attribute table from a bundled rendering library. amplitude is an SVG filter attribute, used by feFuncR and its siblings. It has no relationship to the company of the same name. Every one of the fifteen hits is that table.
“OpenCode ships an OpenTelemetry pipeline.” This one looked even better: more than 150 references to opentelemetry, including protobuf definitions for metrics, traces, logs, and collector endpoints. A full telemetry stack, apparently.
The deciding question is not whether the library is present but whether an exporter is pointed anywhere. Searching for a collector URL returns none. What is present is the set of environment-variable *names* the OpenTelemetry SDK reads, OTEL_EXPORTER_OTLP_ENDPOINT among them. Nothing is configured. It is a pipe with no destination unless you set that variable yourself, which is the same pattern we found when we took apart a different vendor’s SDK and discovered opentelemetry-api had arrived transitively with no exporter shipping.
The rule both mistakes point at is simple, and it is the reason we keep publishing our own errors: a grep count is not a finding. The string tells you a byte sequence is present. Only the surrounding context tells you what it does. Two of our three leads here died on that check, and the one that survived did so because a DSN is not the kind of string that arrives by accident.
What to do about it
Nothing here is concealed, and none of it is unusual for a desktop application. Crash reporting is how software gets fixed, and an Electron app without it is flying blind.
The question is whether it matches your expectations. A local coding agent is often chosen precisely because the work stays on the machine, and most people making that choice are thinking about their code and their prompts, not about stack traces and session reports. Those are different categories of data, and only the first stays put here.
If it matters to you, the practical checks take a minute each. Watch the sockets on launch and see the two connections for yourself. Look for a telemetry setting in the app’s preferences and in its documentation, because the presence of a DSN says nothing about whether an opt-out exists. And treat an unfamiliar established connection as a question rather than an answer, which is the same method we used on LM Studio, where the finding was a proxy rather than a reporter.
The pattern across all of these audits is consistent. The genuinely hidden tracker we found in a shipping coding tool remains the exception. Far more often the data trail is disclosed, ordinary, and switched on by a default nobody reads, and the thing worth knowing is simply which endpoint your machine talks to when you open an application and do nothing at all.